
Adoption tells you how many Microsoft 365 Copilot or GitHub Copilot licenses are switched on. Usage tells you how many people actually submitted a prompt and got something back. If you’re a mid-market IT leader trying to justify the license spend, stop watching enabled-user counts and start watching active-user rate alongside cohort progression, since that combination is what actually predicts recovered billable hours. Open the Microsoft 365 admin Copilot usage report or the GitHub Copilot usage metrics API first, not the invoice.
TL;DR:
- Tracking active-user rate alongside cohort progression better predicts ROI than simply monitoring enabled-user counts or total prompts submitted.
- Usage metrics like prompt acceptance and recent activity filter out superficial engagement signals often mistaken for true adoption.
- Developers’ progression through adoption phases correlates with significant increases in pull request volume, indicating higher actual productivity gains.
- Reallocating dormant licenses and focusing pilots on specific workflows with measurable KPIs improves engagement and accelerates ROI realization.
- Combining telemetry-based insights with targeted workflow rebuilds and automation drives meaningful billable-hour recovery and clarifies true tool value.
Table of Contents
- Adoption vs Usage for Copilot: What Each Term Actually Measures
- What Telemetry Fields Actually Predict Copilot ROI
- Why Cohort Progression Matters More Than a Single Usage Number
- How to Pull Adoption and Usage Numbers from Microsoft and GitHub
- A Practical Framework for Turning Telemetry into ROI
- How to Move Users from Trial to Daily, Productive Usage
- What a Telemetry-First Consulting Engagement Actually Looks Like
- My 90-Day Priority Checklist for IT Leaders
- Get an Outside Audit of Your Copilot Usage Gap
- Primary Sources for Pulling Your Own Numbers
- Sources
Adoption vs Usage for Copilot: What Each Term Actually Measures
Adoption and usage sound like synonyms in most vendor decks. In telemetry, they’re different questions entirely. Adoption asks: how many people have a Copilot license and could use it? Usage asks: how many of them did something intentional with it this week?
Microsoft’s own reporting draws this line precisely. An Enabled User is anyone assigned a Copilot license. An Active User is someone who performed a deliberate action, most commonly submitting a prompt, inside a Copilot-enabled app during the reporting window. Divide active users by enabled users and you get the active-user rate, the single number that separates real adoption from shelfware.
Here’s where most internal reporting goes wrong. Opening the Copilot pane, launching Word with Copilot visible in the ribbon, or signing into Teams does not count as an active action in Microsoft’s Copilot usage report. Only a submitted prompt, and in some cases an accepted suggestion, registers as usage. Firms that count pane opens as “adoption” routinely overstate engagement by a wide margin and miss the workflow friction actually stalling their rollout.
A few measurement traps worth flagging for anyone building an internal dashboard:
- Sign-in counts and app launches are not usage signals; they’re proximity signals.
- Per-app adoption varies widely. A firm can show strong Copilot activity in Outlook while Word and Excel sit untouched.
- “Prompts submitted” and “prompts accepted” are different metrics. A high submission count with a low acceptance rate usually points to a training gap, not a tool problem.
- License counts pulled from procurement records rarely match enabled-user counts in the admin report, since provisioning timing differs.
Get these definitions wrong at the start and every ROI number built on top of them is fiction.
What Telemetry Fields Actually Predict Copilot ROI
Six fields matter more than the rest, and most firms track maybe two of them. Here’s the working list IT teams should pull every reporting cycle:
- Enabled users — total licensed seats, the denominator for every adoption calculation.
- Active users — users who submitted at least one prompt in the period.
- Active-user rate — active divided by enabled; this is the number that belongs in the boardroom deck.
- Prompts submitted — raw engagement volume, useful for trend lines, weak on its own.
- Prompts accepted — the quality signal behind the volume; low acceptance with high submission usually means bad prompting habits, not a bad tool.
- Assisted hours / time saved — a derived estimate, built from feature usage patterns, that maps most directly to billable-hour recovery.
For engineering and software teams running GitHub Copilot, add developer-specific metrics: PR throughput, time-to-merge, and lines-of-code deltas mapped against adoption phase. These matter because code-related productivity gains show up in cycle time long before they show up in a survey.
Statistic Callout: Microsoft’s Copilot usage report typically becomes available within 48 hours of activity occurring, which means a weekly review cadence captures real signal without chasing same-day noise.
On cadence and timeframe: pull data weekly for pilot monitoring, but report monthly to leadership. Weekly numbers swing too much with vacation schedules and single-team pushes to mean much on their own. When choosing a timeframe filter in the admin report, remember the user-level table populates from anyone licensed within the trailing 180 days, including people who left the program or never touched the tool. Filter for recent activity, not just license history, or you’ll understate the active-user rate without realizing it.
Why Cohort Progression Matters More Than a Single Usage Number
A 40% active-user rate tells you almost nothing about depth. Two firms can hit that same number, one with everyone lightly dabbling and one with a smaller group deeply embedded, and their ROI outcomes will look completely different. This is where cohort analysis earns its place in the reporting stack.
GitHub’s Copilot usage metrics API classifies developers into four adoption cohorts: No cohort, Code first, Agent first, and Multi-agent. Assignment isn’t based on a single session. It follows a 2-day-in-28 engagement rule, meaning a developer needs activity on at least two separate days within a rolling 28-day window to land in a meaningful cohort at all. That threshold filters out one-off curiosity clicks and isolates people who’ve actually built the tool into their routine.
Why this matters for ROI: progression between phases correlates with measurable output gains, not just survey sentiment. Analyzed datasets show developers moving from phase one to phase two produced roughly 78% more pull requests, and phase-one to phase-three progression showed gains near 151% more PRs in the same tracked cohorts. That’s not a rounding error. That’s the difference between a license that pays for itself and one that doesn’t.
For non-developer teams, the same logic applies conceptually even without GitHub’s exact phase labels: track how many users go from occasional prompt submission to daily habitual use, and treat that migration as the metric to optimize.
- No cohort: licensed but no meaningful engagement pattern.
- Code first: uses Copilot primarily for inline code suggestions.
- Agent first: relies on agent-mode workflows for larger tasks.
- Multi-agent: coordinates multiple agent workflows, the deepest adoption tier.
Pro Tip: Before buying more licenses, pull your cohort mix. If most of your active users sit in the lowest tier, the problem is enablement, not seat count, and more seats will just create more dormant licenses.
How to Pull Adoption and Usage Numbers from Microsoft and GitHub
Knowing the right metrics doesn’t help if you can’t find them. Here’s the practical path to each report.
- Microsoft 365 admin Copilot usage report. Sign into the Microsoft 365 admin center with global admin or reports-reader permissions, navigate to Reports, then Usage, and select the Microsoft 365 Copilot tab. You’ll see enabled users, active users, active-user rate, and a per-app breakdown showing which tools (Word, Excel, Teams, Outlook) drive activity.
- Viva Insights / Copilot Dashboard. This layer adds organizational context: usage trends by team or department, correlation with meeting load, and manager-level rollups the raw admin report doesn’t surface. Use it when leadership wants a narrative alongside the numbers, not just a table.
- GitHub Copilot usage metrics API. For engineering teams, query the API directly for fields like
ai_adoption_phaseandtotals_by_ai_adoption_phase. The API beats the UI whenever you need to join Copilot data with your own PR or ticketing data, or when you’re reporting across dozens of repositories at once. - Watch the denominator. The user-level table in the Microsoft admin report includes anyone licensed in the trailing 180 days, even people who’ve since had licenses revoked. Filter by recent activity date, not license status, before calculating your active-user rate.
- Confirm permissions before the reporting cycle starts. Reports-reader access differs from full admin access, and Viva Insights often requires a separate license tier. Sort this out ahead of your first board update, not during it.
Timeframe selection matters more than people expect. A 7-day window flatters pilot teams and punishes slower-moving departments; a 90-day window smooths seasonal dips but hides recent momentum. Pull both when you’re building a business case.
A Practical Framework for Turning Telemetry into ROI
The translation from usage data to dollars follows a simple chain: feature usage becomes assisted minutes, assisted minutes become recoverable hours, recoverable hours become either billable revenue or a direct cost offset. The mistake most firms make is skipping straight from “people are using it” to a big ROI number without walking that chain explicitly.
Build the calculation this way:
- Start with active users in a given app, not enabled users.
- Estimate assisted minutes per active user per week, based on feature usage patterns rather than self-reported guesses.
- Convert assisted minutes to hours per month, then multiply by a blended billable rate (for law and accounting firms, this is usually the most defensible number in the model).
- Apply a conservative discount, 20 to 30%, to account for time that would have been spent on the task anyway without Copilot.
- Report a range, not a single figure, and flag your assumptions explicitly for finance.
For a developer-focused example, tie the calculation to cohort progression instead of raw prompt counts.
Statistic Callout: Forrester-style vendor research on Microsoft 365 Copilot cites faster time to market and operating-cost reductions for SMBs integrating Copilot into daily workflows, but treat vendor-commissioned figures as directional, not a substitute for your own telemetry-based model.
For a full worked template, the ROI framework for mid-market firms walks through the billable-hour math step by step.
How to Move Users from Trial to Daily, Productive Usage
Enablement work is where the active-user rate actually moves. Generic training decks rarely change behavior. Specific, role-anchored pilots do.
Start by designing pilots around a single role and a single measurable outcome, not the whole firm at once. A litigation support team piloting Copilot for deposition summaries needs a different success metric than an audit team piloting it for workpaper drafts. Set the KPI before the pilot starts, not after.
Embed Copilot into the artifacts people already touch daily. Engagement letter templates, proposal skeletons, recurring client reports, these are where prompt habits stick. A generic “here’s what Copilot can do” slide deck rarely survives contact with a billable-hour culture; a prompt built directly into the firm’s engagement letter template does.
- Set a 90-day KPI per pilot group before rollout, not after.
- Build 2 to 3 high-frequency templates with prompts pre-loaded, rather than training on open-ended use cases.
- Use telemetry to trigger nudges when a user’s last-activity date crosses a threshold, then measure reactivation over the following 28 days.
- Reassign licenses sitting dormant for 90-plus days to new pilot participants instead of buying additional seats.
- Scale the rollout only when a pilot group hits its stated KPI twice in a row; stop and redesign if it doesn’t.
Pro Tip: Track prompt-to-deliverable conversion, not just prompt volume. A team submitting 500 prompts a month that produces 12 finished deliverables has a different problem than a team submitting 100 prompts that produces 40.
What a Telemetry-First Consulting Engagement Actually Looks Like
Some firms run this measurement work internally with success. Others don’t have the bandwidth, and that gap is exactly where a firm’s IT team should decide whether to bring in outside help.
Gozera’s approach starts with a telemetry baseline: pulling actual usage data before recommending anything, rather than assuming licenses equal engagement. From there, the work identifies dormant licenses sitting unused for 90 days or more, rebuilds two or three high-frequency workflows around Copilot instead of leaving adoption to chance, and fills automation gaps with Python and n8n where Copilot alone can’t close the loop.
The target outcome is recoverable billable time backed by a measurable ROI report, not a vague productivity claim.
- Baseline telemetry audit against enabled-user and active-user data.
- Dormant-license identification and reallocation planning.
- Workflow rebuilds tied to specific templates and deliverables.
- Automation layered on top using Python scripting and n8n workflows.
- ROI reporting anchored to billable-hour recovery, reviewed on an ongoing basis.
Engaging outside help makes the most sense when internal IT lacks the bandwidth to run a proper telemetry audit alongside daily operations, or when the firm needs an outcome report credible enough to bring to partners.
My 90-Day Priority Checklist for IT Leaders
If you’re inheriting a Copilot rollout that’s stalled, resist the urge to buy more licenses or run another training webinar. Fix the measurement first.
Month zero through one: pull your baseline telemetry from the Microsoft 365 admin report, identify every license that’s gone dormant for 90 days, and reallocate two or three of them to a pilot group with a defined KPI. That’s your quick win, and it costs nothing extra.
Month two through three: run targeted pilots around specific templates, not generic training. Recruit two or three champions per department and let their usage patterns, not their opinions, guide the rollout.
By day 90, report three numbers to leadership: active-user rate change, cohort mix shift (if you’re tracking developer usage), and an estimated hours-recovered figure with your assumptions attached. Skip the vanity metrics. Nobody upstairs cares how many licenses are enabled if the active-user rate hasn’t moved.
— Mad
Get an Outside Audit of Your Copilot Usage Gap
Gozera exists for the exact problem this article walks through: firms paying for hundreds of Copilot seats while active-user rate sits in the single digits. Where a generic training vendor sells a workshop and moves on, Gozera runs a telemetry-first audit, finds the dormant licenses actually draining your budget, and rebuilds two or three real workflows so the tool sees daily use instead of quarterly curiosity.
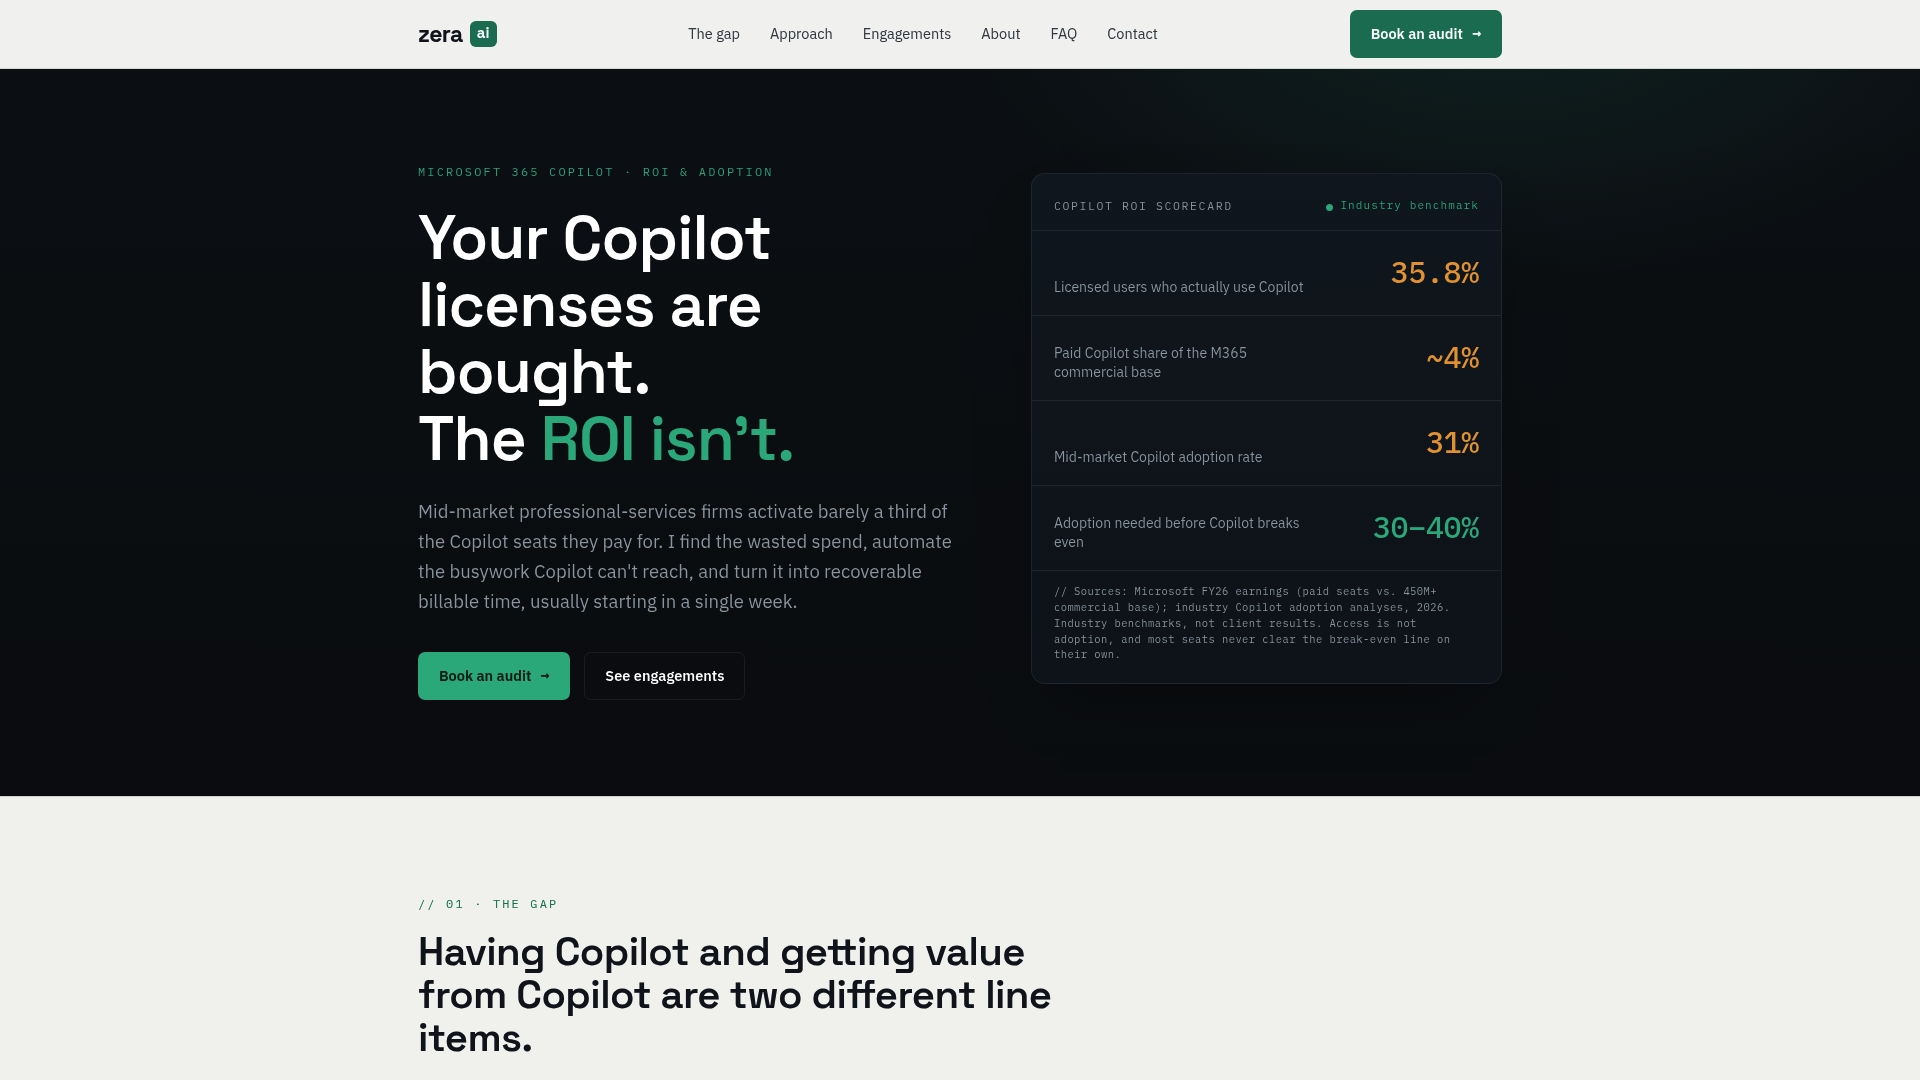
Engagements scale to the problem. A standalone audit maps your current enabled-versus-active gap and dormant-license count. An integration sprint rebuilds specific high-frequency workflows, like engagement letters or recurring client reports, around Copilot with automation support where needed. A monthly retainer keeps the ROI reporting current as usage patterns shift. This fits mid-market law, accounting, consulting, and engineering firms in the 50 to 500 employee range specifically, where a handful of workflow rebuilds move the active-user rate more than a firm-wide license refresh ever would. Explore the Copilot adoption consulting services Gozera offers and book a baseline audit to see where your dormant licenses are actually sitting.
Primary Sources for Pulling Your Own Numbers
- Microsoft Copilot usage report documentation covers exact steps for pulling enabled and active user counts from the admin center.
- The GitHub Copilot usage metrics changelog documents the cohort fields and the 2-day-in-28 engagement rule for developer adoption phases.
- Microsoft’s adoption and engagement templates provide ready-made prompting guides and virtual skilling frameworks for enablement programs.
- For a glossary-level primer on how AI copilots and agent workflows differ conceptually, see this definition of AI copilots.
- Zera’s guide on telemetry-driven license management covers dormant-license detection and nudge automation in more depth.
Sources
- Copilot usage metrics API adds cohorts for AI adoption – GitHub Changelog
- Microsoft Copilot usage report – Microsoft Learn
- Copilot user engagement tools and templates – Microsoft Adoption