
Microsoft Copilot telemetry is the unified system that captures usage, performance, and interaction data from Copilot agents to give IT managers and business leaders a complete picture of software adoption. It combines client-side signals with server-side data collection, using open standards like OpenTelemetry (OTel) and the W3C Trace Context protocol to produce accurate, auditable metrics. For professional services firms paying per seat, this data is not optional reporting. It is the foundation for proving ROI, identifying dormant licenses, and making defensible decisions about Copilot investment. Without it, you are guessing at adoption rates and writing checks you cannot reconcile.
What is Microsoft Copilot telemetry and how does it collect data?
Microsoft Copilot telemetry operates across two distinct collection layers: client-side and server-side. Understanding both is the starting point for any serious adoption measurement program.
Client-side telemetry captures signals directly from the user’s environment, such as editor events in Visual Studio Code, prompt submissions, and completion acceptance rates. The problem is that network proxies and strict enterprise security configurations frequently block these signals before they reach Microsoft’s collection endpoints. Client-side telemetry alone misses users due to network proxies and strict security settings, causing active users to go uncounted and ROI calculations to understate actual adoption.
Server-side telemetry addresses this gap directly. When client signals are blocked, server-side data still records that a user interacted with Copilot, because the interaction reaches Microsoft’s infrastructure regardless of local network restrictions. GitHub Copilot enterprise usage reports now integrate both layers to produce more accurate active user counts, including daily and 28-day active user metrics that previously undercounted real adoption.

OpenTelemetry is the third layer, and it is where IT teams gain the deepest operational visibility. OTel is a vendor-neutral, open-source observability framework that exports traces, metrics, and events from Copilot agents to any compatible backend. Enabling OTel export in Visual Studio Code or via the Copilot SDK TelemetryConfig provides traces and metrics compliant with GenAI semantic conventions, which means your data speaks the same language as the rest of your observability stack.
- Client-side telemetry: Captures editor events and user interactions; vulnerable to proxy and firewall interference.
- Server-side telemetry: Records interactions at the infrastructure level; compensates for blocked client signals.
- OpenTelemetry (OTel): Exports structured traces, metrics, and events to platforms like Azure Application Insights or Grafana.
- W3C Trace Context: Propagates trace identifiers across distributed systems, enabling end-to-end request tracking across SDKs.
Pro Tip: Enable server-side telemetry before you run your first adoption baseline. If you start with client-side data only, your initial numbers will undercount real usage, and every subsequent comparison will be skewed.
Usage metrics vs. observability telemetry: what IT leaders need to know
These two telemetry types serve different audiences and answer different questions. Conflating them is the most common mistake IT managers make when building a Copilot reporting program.
Usage metrics and observability traces serve distinct purposes: usage metrics support business reporting, while OTel traces enable IT troubleshooting and performance monitoring. Usage metrics come from the GitHub REST API and include daily active users (DAU), 28-day active users, AI credit consumption, and feature-level engagement. These numbers belong in executive dashboards and license optimization reviews. Observability telemetry, by contrast, captures spans, latency, tool call sequences, and error rates inside individual agent workflows. That data belongs with your engineering team, not in a board presentation.
| Telemetry type | Primary audience | Key data points | Primary use |
|---|---|---|---|
| Usage metrics (REST API) | IT managers, executives | DAU, 28-day active users, AI credits | Adoption reporting, license ROI |
| Observability telemetry (OTel) | IT engineers, developers | Traces, spans, latency, tool calls | Debugging, performance monitoring |
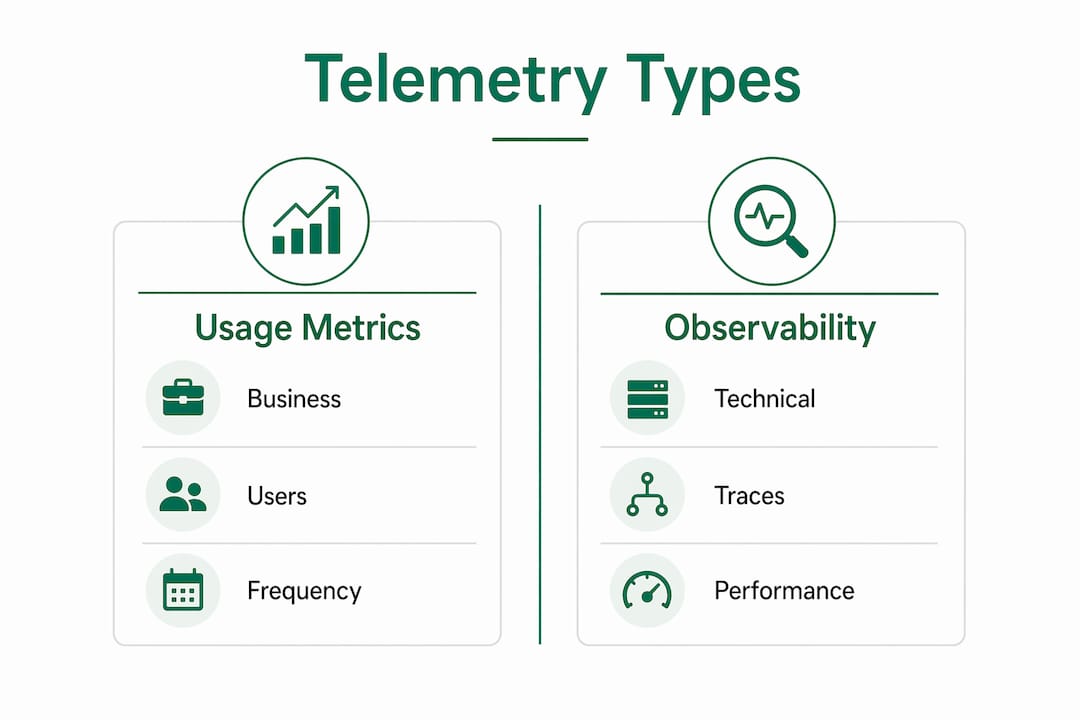
A mature telemetry strategy uses both. Usage metrics tell you who is using Copilot and how often. Observability telemetry tells you why a workflow is slow or failing. Firms that rely only on usage metrics miss the operational signals that predict churn and adoption stalls. Firms that rely only on OTel traces have no executive-ready story to tell about ROI.
Pro Tip: Pull usage metrics on a weekly cadence for executive reporting, and review OTel traces reactively when adoption dips or users report degraded performance. Mixing the two cadences creates noise without adding clarity.
How to implement Copilot telemetry in professional services environments
Getting telemetry configured correctly requires a deliberate sequence. Skipping steps creates data gaps that are hard to diagnose later.
- Enable server-side telemetry in your GitHub enterprise settings. This is the single highest-impact configuration change available. It closes the proxy-related visibility gap immediately and gives you a more accurate baseline from day one.
- Configure OTel export via TelemetryConfig in the Copilot SDK. Set your OTel endpoint to point to Azure Application Insights, Grafana, or your existing observability platform. Grafana dashboards combined with OTel collectors provide effective visualization for Copilot metrics including sessions, tool calls, and model usage latency.
- Connect the GitHub REST API for automated usage reporting. The copilot/copilot-usage-metrics endpoint returns CSV-formatted reports with user-level activity data. Schedule this pull weekly using a Python script or an n8n workflow to feed your executive dashboard automatically.
- Verify W3C Trace Context propagation across your SDK stack. Copilot SDKs across Node.js, Python, Go, and .NET support W3C Trace Context propagation, enabling distributed tracing across tools and platforms. Confirm that trace IDs flow correctly end-to-end before you trust latency data.
- Establish a telemetry governance policy. Define data retention periods, access controls, and privacy compliance requirements before you start collecting. Professional services firms handling client data under attorney-client privilege or CPA confidentiality rules need documented policies for any telemetry that touches billable work.
Beyond configuration, the real value comes from interpretation. Telemetry data points to adoption gaps, but it does not explain them. When DAU drops for a specific team, cross-reference OTel traces to check for latency spikes or failed tool calls. When AI credit consumption is high but active user counts are low, that signals a small group of power users carrying the load while others sit idle. Both patterns require different interventions.
- Review Copilot ROI metrics alongside telemetry data to connect usage patterns to billable time recovered.
- Segment usage metrics by department or practice group to identify where adoption is strong and where training is needed.
- Set threshold alerts in Azure Application Insights or Grafana so your team gets notified when active user counts fall below expected ranges.
Common challenges in Copilot telemetry data and how to fix them
Telemetry data is only as reliable as the infrastructure collecting it. Several failure modes appear consistently across professional services deployments.
- Proxy and firewall interference: Client-side signals blocked by network security tools create undercounts. The fix is enabling server-side telemetry, which previously under-reported users now appear in reports after this configuration change, improving measurement consistency.
- Session telemetry disabled by configuration: Setting EnableSessionTelemetry: false in the Copilot SDK stops internal session telemetry but does not block OTel trace exports. BYOK (Bring Your Own Key) configurations disable all internal telemetry regardless of session settings. Know which configuration your firm uses before interpreting gaps in session data.
- SDK-specific tracing differences: Node.js developers must manually implement an onGetTraceContext callback to inject trace context into distributed requests. Python, Go, and .NET SDKs handle trace context injection and restoration automatically. If your Copilot agent is built in Node.js and you see broken trace chains, this is the first place to check.
- Data discrepancies between client and server metrics: Small differences between client-side and server-side counts are normal. Large discrepancies indicate a configuration problem, usually a misconfigured proxy allowlist or an OTel endpoint that is not receiving data. Reconcile counts monthly and document the delta as a known variance.
- Telemetry stack misalignment: Firms that run Datadog, Splunk, or Azure Monitor as their primary observability platform need to confirm that their Copilot OTel configuration exports to the same backend. W3C Trace Context standardization makes this possible, but it requires deliberate setup.
Pro Tip: Run a telemetry audit every quarter. Compare your REST API active user counts against your OTel session counts. A growing gap between the two numbers is an early warning sign of a configuration drift or a new network policy that is blocking client signals.
Key Takeaways
Accurate Microsoft Copilot telemetry requires both server-side and client-side data collection, structured around OpenTelemetry standards, to give IT managers and business leaders a defensible view of adoption and ROI.
| Point | Details |
|---|---|
| Enable server-side telemetry first | It closes proxy-related visibility gaps and produces more accurate active user counts immediately. |
| Separate usage metrics from OTel traces | Usage metrics serve executive reporting; OTel traces serve engineering and debugging workflows. |
| Automate REST API reporting | Use the copilot/copilot-usage-metrics endpoint with Python or n8n to feed dashboards weekly. |
| Know your SDK tracing differences | Node.js requires a manual callback for trace context; Python, Go, and .NET handle it automatically. |
| Audit telemetry quarterly | Compare REST API counts against OTel session data to catch configuration drift early. |
Telemetry is the discipline most firms skip, and it shows
The firms getting the most from Copilot are not the ones with the most licenses. They are the ones that treat telemetry as a first-class operational discipline, not an afterthought.
The pattern that appears repeatedly in professional services is this: a firm buys 150 Copilot seats, rolls them out with minimal configuration, and then six months later cannot answer a basic question about how many people actually used it last week. The telemetry was never set up correctly. Client-side data was blocked by the firm’s security stack. Nobody connected the REST API to a dashboard. The result is a license renewal conversation with no data to support it.
What works is treating the telemetry setup as part of the deployment, not a follow-on project. That means configuring server-side collection before the first user logs in, connecting OTel to whatever observability platform the IT team already uses, and scheduling a weekly automated pull from the usage metrics API. The licensing and telemetry implications for IT managers are significant enough that this setup deserves the same attention as the Copilot rollout itself.
Usage metrics translated into plain language, such as “42 of your 80 licensed users were active last month,” are exactly the kind of data that drives partner-level decisions about whether to expand, retrain, or restructure the deployment. Telemetry is not a technical report. It is a business instrument.
Zera helps professional services firms get real value from Copilot telemetry
Copilot telemetry is only useful if someone is reading it, interpreting it, and acting on it. Zera works with law firms, accounting practices, and consulting groups to configure telemetry correctly from day one, connect usage data to executive reporting, and identify exactly where adoption is stalling.
Zera’s approach starts with a baseline measurement of actual Copilot usage across your licensed seats, using both server-side metrics and OTel data. From there, the team identifies dormant licenses, rebuilds workflows where Copilot can recover billable time, and delivers a clear ROI picture your partners can act on. If your Copilot investment is not producing measurable results, Zera’s adoption consulting gives you the data and the plan to change that.
FAQ
What is Microsoft Copilot telemetry?
Microsoft Copilot telemetry is the collection of usage, performance, and interaction data from Copilot agents, gathered through client-side signals, server-side infrastructure, and OpenTelemetry exports to give IT managers a complete view of adoption and system behavior.
Why does my Copilot telemetry undercount active users?
Client-side telemetry is frequently blocked by enterprise proxies and security configurations, causing active users to go unrecorded. Enabling server-side telemetry in your GitHub enterprise settings corrects this undercounting.
What is the Copilot telemetry API?
The GitHub REST API endpoint copilot/copilot-usage-metrics returns CSV-formatted, user-level activity reports that IT managers can pull programmatically for automated ROI tracking and executive dashboards.
How does OpenTelemetry work with Copilot?
OpenTelemetry exports traces, metrics, and events from Copilot agents to platforms like Azure Application Insights or Grafana, following GenAI semantic conventions and W3C Trace Context standards for distributed tracing across SDKs.
Does disabling session telemetry stop all Copilot data collection?
Setting EnableSessionTelemetry: false stops internal session telemetry but does not block OpenTelemetry trace exports. BYOK configurations, however, disable all internal telemetry regardless of session settings.