
To measure Microsoft 365 adoption, enable the Adoption Score People experiences, export 30-day Admin center usage reports, and install the Copilot Power BI template — then track these six signals weekly: active users (windowed), DAU/MAU ratio, feature session counts per workload, Copilot prompt and session volume, enablement-event lift, and license utilization rate.
That one-sentence setup gives you a repeatable baseline. Here is what to track from day one:
- Active users (windowed): unique users performing intentional actions within a selected time window (7, 30, 90, or 180 days)
- DAU/MAU ratio: daily active users divided by monthly active users — a proxy for habit formation, not just access
- Feature sessions per workload: Teams meetings joined, SharePoint files edited, Copilot prompts submitted — workload-specific signals that show depth of use
- Copilot prompts and sessions: total prompts submitted and sessions completed per licensed user per week
- Enablement-event lift: the measurable change in DAU or feature sessions correlated with a training event or communication campaign
- License utilization rate: active users divided by assigned licenses — the fastest way to find idle spend
Your first action this week: enable Adoption Score People experiences in the Microsoft 365 admin center, export a 30-day CSV from the activity reports, and connect the M365UsageAnalytics Power BI template to your tenant.
Table of Contents
- How to measure Microsoft 365 adoption: where the data lives
- What KPIs actually tell you about adoption
- How to set up repeatable adoption reporting
- How to read the numbers and act on them
- Gozera’s measurement and improvement workflow
- Common pitfalls and privacy considerations
- Key Takeaways
- What the adoption score misses
- Gozera turns your adoption data into a clear ROI case
- Useful sources
How to measure Microsoft 365 adoption: where the data lives
Microsoft gives you five native telemetry sources. Each covers a different slice of the picture, and knowing which one to reach for first saves hours of setup.
Microsoft Adoption Score
The Adoption Score aggregates People experiences across six categories: communication, meetings, content collaboration, teamwork, mobility, and onboarding. As of January 22, 2026, Microsoft retired the Technology experiences categories, so the maximum possible score dropped from 900 to 600. The overall score updates daily based on the last 28 days of activity. Sub-scores use both 28-day and 180-day views depending on the category.

Group Level Aggregates extend the score further. A Global Administrator can enable segmentation by Entra ID attributes — department, region, job function — so you can see which practice groups at your firm are lagging and target enablement precisely.
Microsoft 365 admin center usage reports
The admin center activity reports cover 7, 30, 90, and 180-day windows. Data typically lands within 24–72 hours of the activity occurring. By default, user-level details are hidden to comply with privacy controls, but administrators can export CSV or Excel files for offline analysis or pipe the data through the Microsoft Graph reports API for programmatic access.
Microsoft 365 Copilot adoption Power BI template
The M365UsageAnalytics template on GitHub includes dedicated pages for M365 App Usage, Usage Trends, Copilot License Recommendations, and a Copilot Enablement quadrant. When Purview audit logs are enabled, the template surfaces per-user prompt and session counts. Prerequisites: a Copilot license assigned to the reporting account, Global Admin or Reports Reader role, and Purview audit logging turned on.
Microsoft Graph reports API
The Graph reports API lets you pull structured telemetry into any data model — Power BI, a Python pipeline, or a custom dashboard. It is the right path when you need cross-workload joins, historical retention beyond the admin center’s 180-day cap, or automated scheduled exports.
Experience insights dashboard

The Experience insights dashboard, accessible from the admin center, lets you log enablement events (training sessions, communications, champion campaigns) and overlay them against usage trends. Microsoft’s own internal teams used it to correlate a single event with a 33,000-user increase in Viva Engage activity — a concrete example of why logging your enablement actions matters.
Pro Tip: Start with the admin center reports and Adoption Score before touching the Graph API. The native reports answer 80% of adoption questions with zero engineering work. Reach for the API only when you need custom segmentation or cross-workload joins the admin center cannot produce.
What KPIs actually tell you about adoption
Tracking the right metrics is less obvious than it sounds. Most teams default to active-user counts and stop there. That misses the behavioral depth that separates real adoption from license compliance.
The canonical KPI set
| Metric | Purpose | Typical calculation | Reporting window | Business outcome |
|---|---|---|---|---|
| Active users (windowed) | Breadth of use | Unique users with intentional activity ÷ total licensed users | 30 days | License ROI baseline |
| DAU/MAU ratio | Habit formation | Daily active users ÷ monthly active users | 28 days | Productivity depth |
| Activation rate | Onboarding health | Users who completed first intentional action ÷ total assigned licenses | 7 days post-assign | Onboarding efficiency |
| Feature sessions per workload | Depth of use | Sessions in Teams, SharePoint, Copilot, etc. per active user | 30 days | Workflow integration |
| Copilot prompts and sessions | AI value signal | Total prompts submitted; sessions completed per licensed user | Weekly | Billable time recovered |
| Enablement-event lift | Training ROI | DAU delta in 14 days post-event vs. 14-day pre-event baseline | Per event | Enablement effectiveness |
| License utilization rate | Cost control | Active users ÷ assigned licenses | 30 days | License cost savings |
| Retention of active users | Stickiness | Users active in month N who were also active in month N-1 | Monthly | Long-term adoption health |
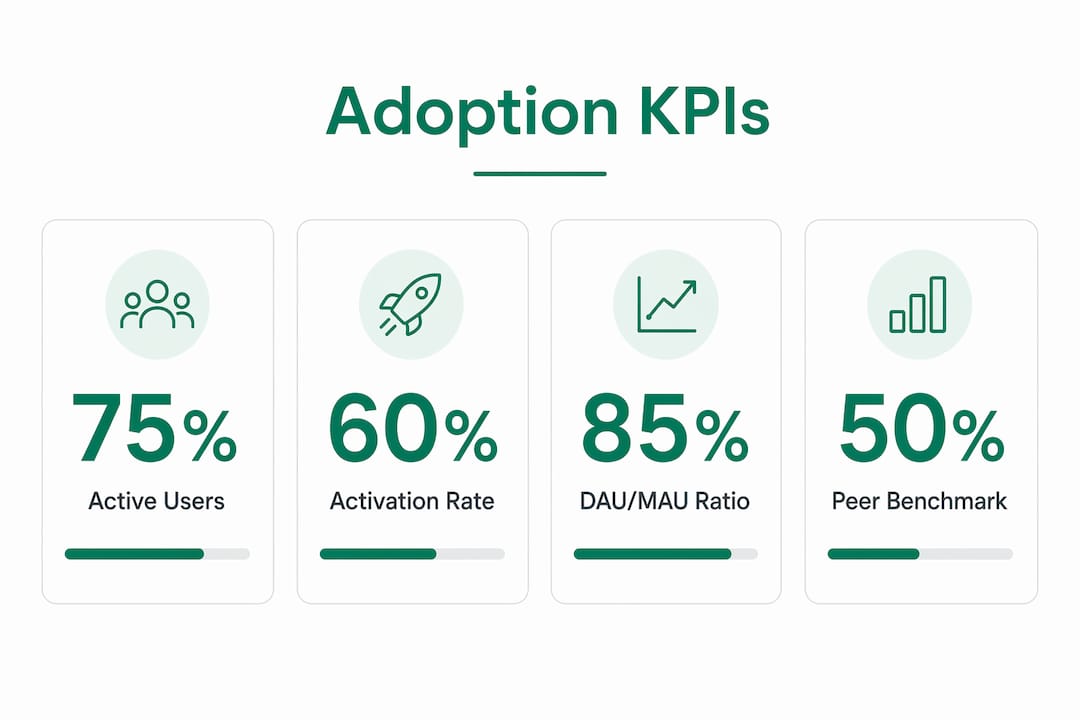
Metric types fall into three categories. Activation metrics (activation rate, first-use date) tell you whether users got started. Active-use metrics (DAU/MAU, feature sessions, Copilot prompts) tell you whether they are building habits. Retention and outcome metrics (month-over-month retention, billable time recovered, license utilization) tell you whether the investment is paying off.
For mid-market professional-services firms, a healthy DAU/MAU ratio for a core workload like Teams is considered to indicate that users are actively engaged on a substantial portion of days in a month. A low Copilot license utilization rate signals that licenses may be idle and could require reclamation or targeted enablement.
The Adoption Score’s peer benchmark feature lets you compare your organization’s People experiences scores against those of similar-sized tenants. Use that benchmark to set realistic targets rather than chasing an arbitrary internal goal.
Pro Tip: Classify users into five tiers — Daily, Frequent, Moderate, Light, and Inactive — based on their activity counts. This segmentation makes license reclamation decisions defensible and gives your enablement team a prioritized list of who to reach next.
How to set up repeatable adoption reporting
Getting from zero to a working dashboard takes about a week if you follow these steps in order.
- Enable Adoption Score People experiences in the Microsoft 365 admin center under Reports > Adoption Score. Confirm your role is Global Admin, Reports Reader, or Usage Summary Reports Reader.
- Enable Group Level Aggregates so Adoption Score filters by Entra ID attributes. A Global Administrator must turn this on under Adoption Score settings.
- Configure Purview unified audit logging if it is not already active. This is a prerequisite for per-user Copilot telemetry in the Power BI template.
- Export a 30-day Admin center CSV from Reports > Usage > Microsoft 365 Apps active users. This becomes your baseline file.
- Install the M365UsageAnalytics Power BI template from GitHub. Connect it to your tenant using the Graph reports API connector, then publish to a Power BI workspace with scheduled refresh.
- Set up the Copilot adoption report within the template. Verify that Copilot license data and Purview logs are flowing before interpreting prompt counts.
- Schedule automated exports via the Graph reports API for any metric the admin center does not retain beyond 180 days. A lightweight Python or Power Automate flow works well here.
Choosing the right time window
| Window | Best for | Latency |
|---|---|---|
| 7 days | Activation rate, onboarding checks | 24–72 hours |
| 30 days | Active users, DAU/MAU, Copilot sessions | 24–72 hours |
| 90 days | Feature adoption trends, enablement lift | 24–72 hours |
| 180 days | Retention, churn of active users | 24–72 hours |
| 12 months | Long-term trend analysis, license planning | Full calendar month lag |
The 12-month Power BI dashboard is the right tool for annual license reviews and board-level reporting. For weekly operational checks, the 30-day admin center report is faster and sufficient.
Pro Tip: Normalize every export by user ID before joining workloads. Mismatched UPNs between Entra ID and the activity reports are the single most common reason adoption dashboards show inflated inactive-user counts. Map Entra AD attributes at the ETL stage, not after the fact.
For technical guidance on mapping Purview audit logs to user engagement signals, Gozera’s telemetry guide covers the exact field mappings and ETL patterns.
How to read the numbers and act on them
A metric without a mapped action is just a number. Here is how specific signal patterns should drive specific decisions.
- Rising activation, low 30-day retention: Users started but did not build habits. Run a targeted advanced-use training session for that cohort within 14 days of activation. Overlay the event in Experience insights and measure the DAU delta over the following two weeks.
- High Copilot prompt volume, low session completion: Something is creating friction — a policy block, a UI gap, or prompts that are not producing useful outputs. Audit the Copilot usage logs for error rates and check whether sensitivity labels are blocking responses.
- License utilization below 50%: Segment by department using Entra ID attributes. Identify which groups have the lowest utilization and either reclaim those licenses or assign a champion and a 30-day enablement sprint before deciding. Gozera’s guide on reducing idle licenses walks through the reclamation math in detail.
- Flat DAU/MAU despite high activation: The product is being opened but not used meaningfully. This usually means the workflow integration is missing — users have Copilot but no embedded use case in their daily work.
Before and after: what measurable outcomes look like
| Scenario | Baseline | After intervention | Intervention |
|---|---|---|---|
| DAU lift after targeted training | DAU/MAU: — | DAU/MAU: — | 2-hour advanced Teams training for one practice group |
| License utilization improvement | — | License utilization improved noticeably among reclaimed and reallocated licenses. | License reclamation + reallocation to high-use roles |
| Copilot session completion | — | — | Prompt library deployed; policy friction removed |
The Experience insights Actions tab is where you log each enablement event and then watch the correlated usage change. Microsoft’s internal teams use exactly this approach to measure enablement effectiveness — logging every training, communication, and champion activity, then identifying which types reliably move DAU.
For executive reporting, the CFO wants two numbers: license cost per active user and estimated billable time recovered. Practice leaders want behavioral signals: which teams are using Copilot in client-facing workflows and which are not. Build two separate report pages in Power BI — one for each audience. For a deeper look at translating behavioral uplift into billable-time ROI, Gozera’s ROI framework covers the full calculation.
Pro Tip: Run pilots with a modestly sized cohort over a typical period and a control group that receives no enablement. The contrast between cohorts is what makes the ROI case credible to a CFO — not the absolute numbers alone.
Gozera’s measurement and improvement workflow
Gozera runs a structured 6–8 week engagement that takes a firm from zero telemetry to a working adoption dashboard and a prioritized action plan. Here is the methodology in outline form:
- Week 1–2: Baseline telemetry collection. Export 30-day and 90-day admin center reports, enable Adoption Score Group Level Aggregates, and install the M365UsageAnalytics Power BI template. Map Entra ID attributes to the user activity data.
- Week 2–3: Segmentation and tier classification. Classify every licensed user into an activity tier (Daily, Frequent, Moderate, Light, Inactive) by workload. Identify the highest-value cohort for the first enablement sprint.
- Week 3–5: Enablement and experimentation sprint. Run a targeted training or workflow-integration session for the pilot cohort. Log the event in Experience insights. Track DAU and feature session lift daily.
- Week 5–6: License optimization. Use the Copilot License Recommendations page in the Power BI template to identify candidates for reclamation or reallocation. Build the license cost savings model.
- Week 6–8: Automation and workflow integration. Identify the two or three Copilot use cases with the highest session completion rates and embed them into the firm’s existing workflows using Copilot workflow patterns for professional services.
- Ongoing: ROI validation and optimization. Deliver a monthly dashboard update, a license-reclamation plan, and an ROI model that ties behavioral uplift to billable time recovered and license cost savings.
Clients receive a Power BI dashboard, a prioritized enablement list ranked by expected lift, a license-reclamation plan with cost savings estimate, and an ROI model they can present to leadership. The minimum data prerequisites for a pilot are: 30 days of admin center activity data, Entra ID group attributes mapped, and Purview audit logging enabled.
Pro Tip: The ROI model inputs you need to collect before the pilot ends: average billable rate per role, estimated minutes saved per Copilot session by task type, number of sessions per user per week, and current license cost per user. With those four inputs, the ROI calculation is straightforward.
Common pitfalls and privacy considerations
Even well-intentioned measurement programs run into the same traps. Here is what to watch for.
- Over-relying on activation as a success metric. A user who opened Teams once in 30 days counts as “active” in some reports. Activation is a starting point, not evidence of value. Always pair it with a depth metric like DAU/MAU or feature sessions.
- Ignoring cross-workload signals. Surface-level activity counts do not reveal cross-workload collaboration density or feature-velocity metrics needed for ROI analysis. A user active in Teams but never using Copilot in Word or Outlook is a partial adopter, not a full one.
- Stale data windows. Using a 7-day window to evaluate a training campaign that ran three weeks ago produces misleading results. Match the reporting window to the intervention timeline.
- Poor Entra ID mapping. If your Entra ID group attributes are incomplete or inconsistent, group-level aggregates will be unreliable. Audit your directory data before enabling segmentation.
- Using individual-level telemetry for performance management. This is both a privacy risk and a trust risk. Microsoft’s admin center hides user-level details by default for exactly this reason. Use group-level aggregates for enablement decisions and keep individual data in role-scoped reports accessible only to IT administrators.
US organizations should align their reporting practices with internal privacy policies and any applicable state-level data protection requirements. The admin center’s default privacy settings (user details hidden) are a reasonable starting point. If your firm needs per-user data for license reclamation, scope that access to a Reports Reader role and document the business justification.
Pro Tip: Annotate every data gap directly in your Power BI report. If Purview logging was not enabled for the first two weeks of a pilot, note it on the dashboard. Unexplained gaps in a report undermine executive confidence more than the gap itself does.
Key Takeaways
Measuring Microsoft 365 and Copilot adoption requires six behavioral signals, three Microsoft telemetry sources, and a repeatable Power BI pipeline tied to business outcomes — not a single activation count.
| Point | Details |
|---|---|
| Start with three native sources | Enable Adoption Score, export 30-day admin center CSV, and install the M365UsageAnalytics Power BI template before anything else. |
| Track depth, not just breadth | DAU/MAU ratio and feature sessions per workload reveal habit formation; active-user counts alone do not. |
| Segment by Entra ID groups | Group Level Aggregates let you target enablement at the department or role level, which is faster and more effective than org-wide campaigns. |
| Map signals to actions | Rising activation with low retention means advanced training; license utilization below 50% means reclamation or reallocation within 30 days. |
| Gozera’s 6–8 week pilot | Gozera delivers a baseline dashboard, license-reclamation plan, and ROI model within 6–8 weeks for mid-market professional-services firms. |
What the adoption score misses
The Adoption Score is a useful compass, but it is not a business outcome. A firm can score well on communication and meetings while Copilot licenses sit completely idle — because the score does not weight AI feature usage heavily enough to surface that gap on its own.
The more useful frame is this: pick two or three workflows where Copilot should be saving time — drafting client memos, summarizing meeting notes, reviewing contracts — and measure the session completion rate and estimated time saved for those specific tasks. That number, multiplied by your average billable rate, is the ROI figure your managing partner actually cares about. The Adoption Score tells you whether people are using Microsoft 365 broadly. It does not tell you whether the investment is paying off.
Chasing a perfect 600/600 Adoption Score is a distraction. Firms that focus on business-aligned categories — the ones tied to their highest-value workflows — get to a defensible ROI number faster and with less organizational friction. Measurement is also not a one-time exercise. The firms that sustain adoption gains treat the dashboard as a live operational tool, not a project deliverable.
Gozera turns your adoption data into a clear ROI case
Most mid-market firms have the telemetry. What they lack is the time and the framework to turn raw Microsoft usage data into a number the CFO will act on. Gozera’s Copilot adoption engagements are fixed-price, scoped to 6–8 weeks, and deliver four concrete outputs: a Power BI adoption dashboard, a prioritized enablement plan, a license-reclamation model with cost savings estimate, and an ROI report tied to billable time recovered.
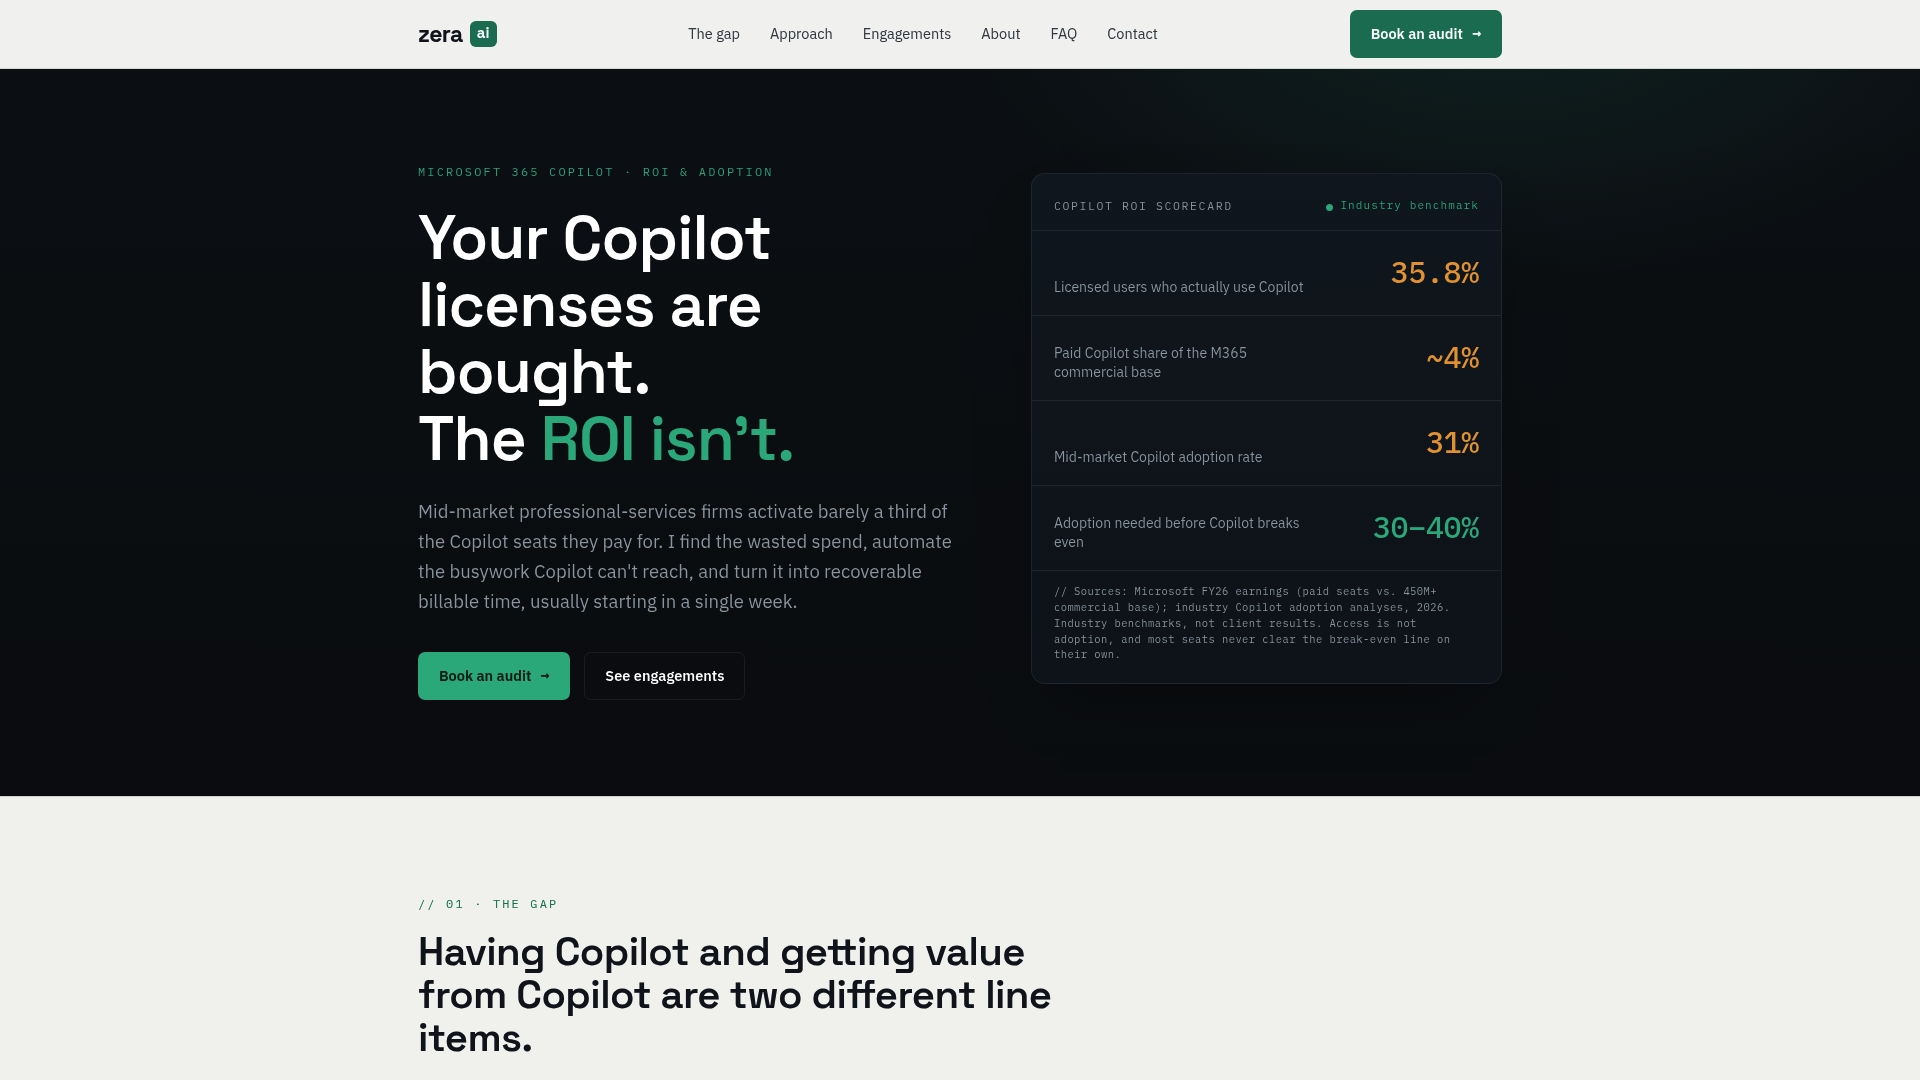
The engagement starts with a baseline audit — pulling 30 and 90-day admin center data, mapping Entra ID groups, and classifying every licensed user by activity tier. From there, Gozera runs a targeted enablement sprint for your highest-value cohort, measures the lift, and builds the automation or workflow integrations that make the gains stick. No multi-year change management program. No vague productivity claims.
If your Copilot licenses are underperforming, the data will show exactly where and why within the first two weeks. Book a scoping call with Gozera to see what your current telemetry already reveals.
Useful sources
The following official Microsoft documentation and templates were used to build and validate this guide.
- Microsoft Adoption Score overview — covers score calculation, People experiences categories, and the January 2026 Technology experiences retirement
- Activity reports in the Microsoft 365 admin center — time windows, data latency, export options, and privacy defaults
- Microsoft 365 Apps Active Users report — per-user activity breakdown and license assignment data
- Microsoft 365 usage analytics overview — Power BI prebuilt dashboard, 12-month trend data, and department-level slicing
- M365UsageAnalytics Power BI templates (GitHub) — Copilot adoption template, license recommendation pages, and Purview export integration
- Microsoft Adoption Score (adoption.microsoft.com) — Group Level Aggregates setup and Entra ID segmentation guidance
- Measuring employee user enablement at Microsoft — Experience insights Actions tab, event-overlay methodology, and the 33,000-user Viva Engage case
- Microsoft 365 Copilot adoption report — Viva Insights analyst template for Copilot session and prompt analytics
- Gozera Copilot adoption and ROI consulting — implementation support for the measurement pipeline described in this guide